 monkey
What Monkeygun actually does, in five shows we built this weekend
The short version: Monkeygun turns data into videos, and keeps doing it. You point it at something that changes: an exchange's prices, a sports table, a weather feed, card sales, a leaderboard, your own spreadsheet. Every time it changes, Monkeygun designs a short video about what changed, checks every number against the source, records a voiceover and posts it to your channels.
That's easier to show than to explain, so this weekend we built five shows from public data. None of them was edited by hand.
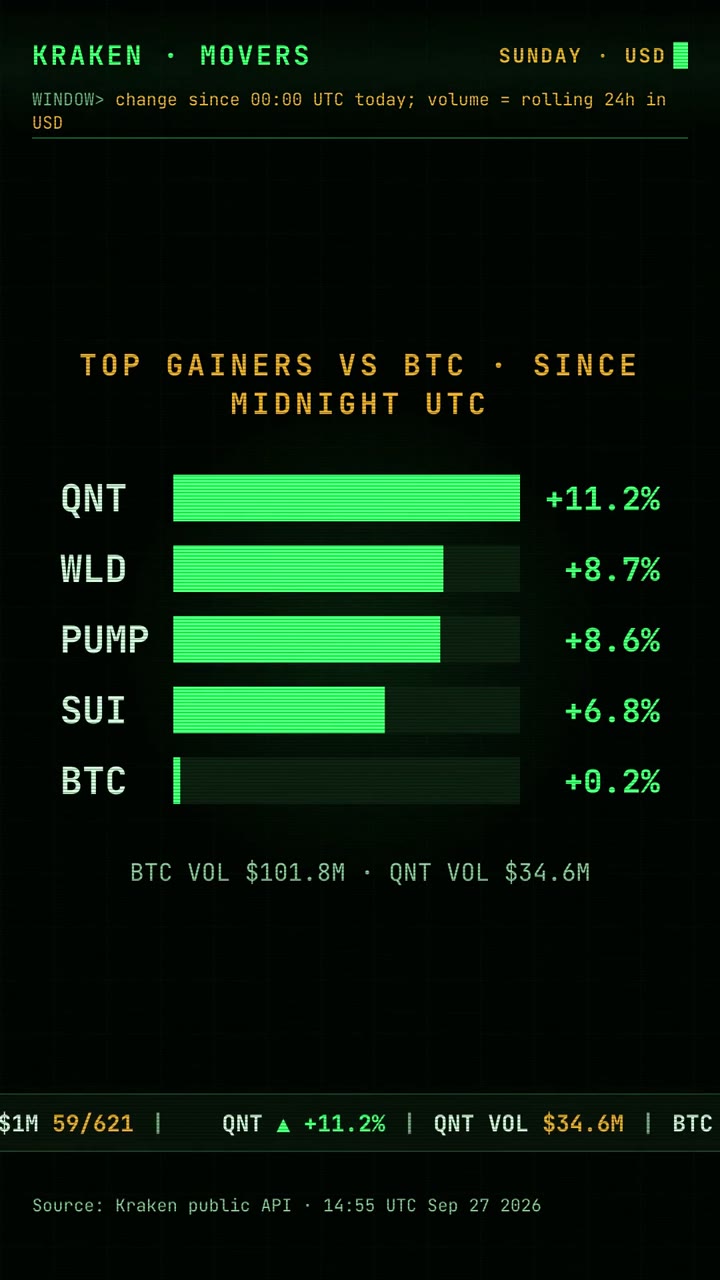
1. An exchange movers desk
Source: Kraken's public market-data API. Every USD pair, filtered to pairs with at least $1M of 24-hour volume, ranked by change since midnight UTC.
Who it's for: exchanges and brokers. The same show can run every morning in the exchange's own brand, and a listing or a weekly recap works the same way. Every figure comes straight from the feed, which is what a compliance team needs to see.
2. A weather desk
Source: the National Hurricane Center's public advisories. On Sunday morning five tropical systems were active at once, and the video plots each one, zooms into the only major hurricane and names the coasts under warnings.
Who it's for: local news, weather apps and anyone with a feed that updates on its own clock. The as-of time sits on screen, so an old episode never passes for a new one.
3. A sports stat desk
Source: the MLB Stats API, pulled before first pitch on the last day of the regular season, when one National League wild-card spot was still open. The video explains the elimination math in plain words and lines up the two games that decide it.
Who it's for: sports media, fantasy and betting-adjacent apps, and team channels. Standings, box scores and player lines are all tables that change every night.
4. A collectible price show
Source: PriceCharting's graded sale averages plus TCGplayer's marketplace listings. Grail Report is a daily show about one original Base Set Pokémon card: who the card is, what the market did with it this year, and the full grade ladder from ungraded to PSA 10.
Who it's for: marketplaces, grading companies, card shops and collector channels. It's a daily show with a different card every day, and nobody has to write a script.
5. A live contest desk
Source: the referee feed of a live agent trading contest. Every 12 hours a news-style bulletin reports new entrants, lead changes, ties and hours to the lock, and a page keeps the full archive.
Who it's for: anyone running a competition, a leaderboard, a campaign or a launch with a clock on it. See the live desk at monkeygun.com/live/close-call.
What happens under the hood
- We fetch the data from the source you connect: an API, a sheet, a page, a report or a folder of footage.
- The model designs the episode as code in one of eleven looks, from a trading terminal to a nature documentary. The format stays consistent from episode to episode, and the content follows the data.
- It never types a number itself. Every figure on screen and in the voiceover is filled in from the source, and the check sends the video back if anything doesn't match.
- A render check rejects overlapping text, clipped words and anything that would look wrong on a phone. Then the voiceover is recorded one line per beat, in your choice of voice and in 13 languages.
- The finished episode lands in a review queue, goes out as a draft, or posts itself to TikTok, Instagram, YouTube, X and LinkedIn through Buffer. You pick the policy per show.
Where to start
- If you want a channel that runs itself, start at monkeygun.com/autopilot: pick a source, a show format and your channels, and approve the first episodes.
- If you're a developer, the API is one call from data to video. The docs are at monkeygun.com/docs, with runnable examples.
- If you're an exchange, a marketplace or a data company, we'll cut a free sample from your own public data. DM @monkeygunhq on X or reply to any of our posts.